Project Overview
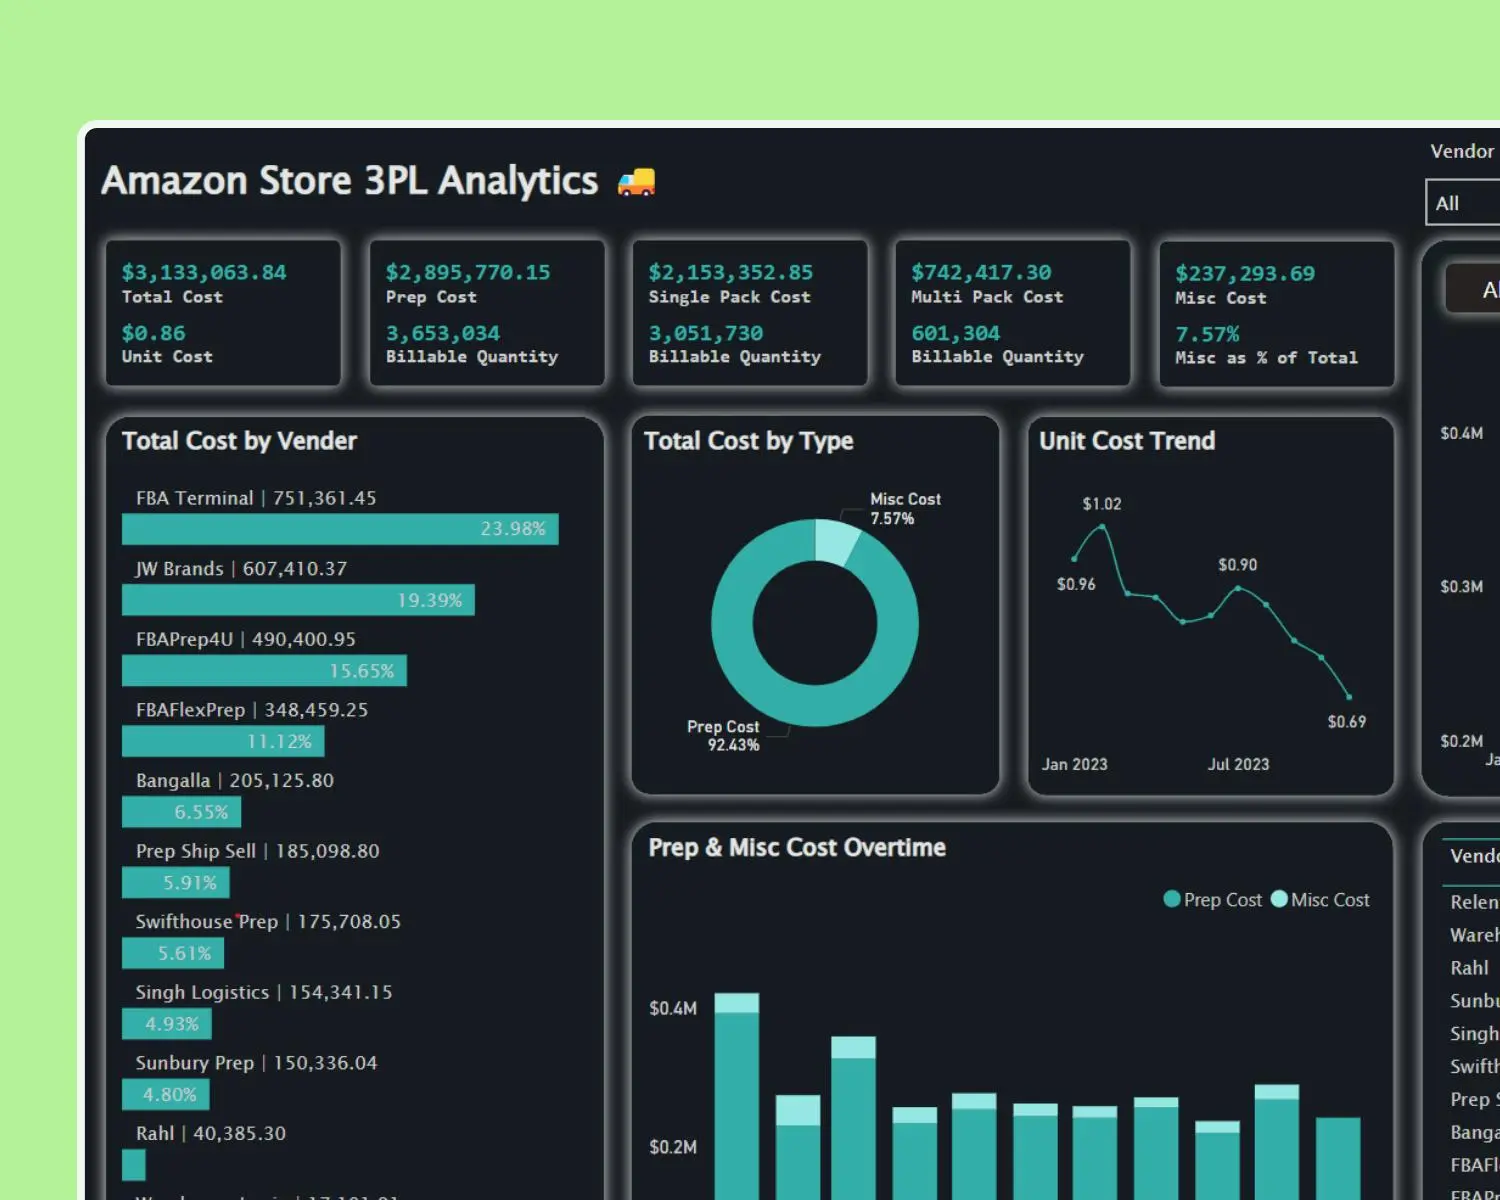
This project aimed to assist an Amazon seller in visualizing their 3PL (Third-Party Logistics) data. The seller was struggling to track the 3PL costs due to the volume of data, vendors' sales volumes, and locations. The goal was to create a centralized dashboard to monitor costs per pack size per vendor and track unit costs over time. This would enable comparisons of unit costs for each vendor, facilitating better decision-making.
Project Specifics
-
Real-time data visualization
-
User-friendly interface
-
Customizable widgets
-
Cost tracking per pack size and vendor
-
Historical data comparison and trend analysis
Data Integration
The project integrated data from multiple sources, including:
- Scan Power
- NetSuite
- Asana We used tools like Python, Google Sheets, SQL, and Power BI to Extract, Transform, and Load (ETL) the data, ensuring seamless integration and accurate visualization.
User Experience
The dashboard offers an intuitive and user-friendly experience, making it easy for the seller to navigate and analyze data. The design is clean and accessible, providing clear insights at a glance.


Technology Stack
The technologies and tools used in the development include
- Programming Languages: Python, SQL.
- Data Visualization: Power BI.
- Data Management: Google Sheets.
- Project Management: Asana
Security and Compliance
We ensured data security and compliance with relevant regulations. The data integration process included secure handling and storage protocols, maintaining the confidentiality and integrity of the seller's data.
Conclusion
The 3PL Cost Visualization Dashboard project was a success, providing the seller with valuable insights and cost-saving opportunities. Future updates will include additional features and enhancements to further streamline data tracking and analysis.
Get in Touch
Are you struggling with managing your financial and advertising data? Let us simplify it for you. Contact us at info@books-advisor.com for assistance.


